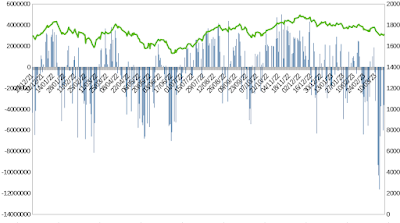
Updated Historical Reliance Indistries Gamma Exposure Chart

Below is the historical chart of Reliance Industries GEX for the period from December 27, 2021, to March 29, 2023. The chart indicates that as the stock price increases, the GEX of the stock remains positive, and the volatility decreases. On the other hand, when the stock price declines, the GEX remains in negative territory with increase in volatility.


Nifty GEX at What is GEX (Gamma Exposure)? .

Historically how Nifty GEX has moved at Historical Nifty GEX

Other links:

Other methodologies for calculation of GEX How to Calculate Gamma Exposure (GEX) and Zero Gamma Level 


Nifty Gamma Exposure 29th March 2023

On March 29th, 2023, the value of NiGex (the Nifty GEX Gamma Exposure) increased and closed at -21L, which was higher than the previous day's value. However, it's important to note that no inferences should be drawn again from this.

Taking a look at the past 200 days of NiGex, it's clear that there have been significant variations in its value. The mean value over this period was -113K, while the median value was 743K. The range of values has been substantial, with a minimum of -116L and a maximum of 50L. This data underscores the importance of conducting thorough research and exercising caution before making any investment decisions related to NiGex.

For further information on Gamma Exposure and NiGex, visit the article at What is GEX (Gamma Exposure)?

 To know more about VIX, visit the NSE page at VIX

Nifty Gamma Exposure 28th March 2023

On March 28th, 2023, the value of NiGex (the Nifty GEX Gamma Exposure) decreased and closed at -68L, which was lower than the previous day's value. However, it's important to note that no inferences should be drawn from this single-day decrease, as today is monthly and quarterly expiry.

Taking a look at the past 200 days of NiGex, it's clear that there have been significant variations in its value. The mean value over this period was -102K, while the median value was 743K. The range of values has been substantial, with a minimum of -116L and a maximum of 50L. This data underscores the importance of conducting thorough research and exercising caution before making any investment decisions related to NiGex.

For further information on Gamma Exposure and NiGex, visit the article at What is GEX (Gamma Exposure)?

 To know more about VIX, visit the NSE page at VIX


Nifty Gamma Exposure 27th March 2023

NiGex, the Nifty GEX Gamma Exposure, experienced a slight but promising increase in value on March 27th, 2023. The closing value of -59L was higher than the previous day's value, indicating an improvement in the market structure. While NiGex is known for its significant fluctuations, the recent positive trend is not unique to it alone.

In addition to NiGex, global markets, including the SPX, showed signs of recovery from previous lows due to the fall of Silicon Valley bank and Credit Suisse. This suggests that the current market trend could be advantageous for investors. However, given the unpredictable nature of the market, caution and thorough research are advised when making any investment decisions.

Compared to VIX, which tracks market expectations of near-term volatility based on Nifty 50 index options, NiGex is a more reliable gauge of market volatility. NiGex considers a broader range of market factors, including market movement and liquidity, making it a more comprehensive tool for assessing market fluctuations over time.

Investors looking to navigate the global market can take comfort in the recent positive trend in NiGex, combined with the broader market recovery. However, it's essential to conduct due diligence and research before making any investment decisions.

Analyzing the past 200 days of NiGex, the mean value was -74K, with a median value of 743K. These numbers demonstrate the significant variations in NiGex, with a minimum value of -116L and a maximum value of 50L. It highlights the importance of thorough research and caution before making investment decisions.

Read more on Nifty GEX at What is GEX (Gamma Exposure)?

Historical Reliance Indistries Gamma Exposure Chart

Below is the historical chart of Reliance Industries GEX for the period from December 22, 2021, to March 24, 2023. The chart indicates that as the stock price increases, the GEX of the stock remains positive, and the volatility decreases. On the other hand, when the stock price declines, the GEX remains in negative territory with increase in volatility.


Nifty GEX at What is GEX (Gamma Exposure)? .

Historically how Nifty GEX has moved at Historical Nifty GEX

Other links:

Other methodologies for calculation of GEX How to Calculate Gamma Exposure (GEX) and Zero Gamma Level 

 What is VIX? VIX

Nifty Gamma Exposure 24th March 2023

The NiGex (Nifty GEX Gamma Exposure) experienced a decline in its value on March 24th, 2023, closing at -70L, which is lower than the previous day's value. The market structure remains unchanged compared to the previous day.

The NiGex has a history of significant fluctuations, which is evident from its statistical measures over the last 200 days. The mean value during this period was -388K, and the median value was 205K. The value of NiGEX has varied considerably, with a minimum value of -116L and a maximum value of 50L.

Read more on Nifty GEX at What is GEX (Gamma Exposure)?

Sector GEX: A Better Way to Gauge Market Volatility?

Investors have long relied on measures such as Volatility Index (VIX) to determine market volatility. However, there is now an alternative tool that may provide more accurate information. These tables not only provide descriptive statistics but also serve as a substitute for traditional volatility measures.


So, how do these tables work, and why are they better? First, let's look at what GEX stands for. GEX is short for "Gamma Exposure." Gamma is the rate of change of an option's delta, which measures the option's sensitivity to price changes in the underlying asset. 

The use of GEX as a substitute for measuring volatility is based on the fact that option powerhouses tend to buy low and sell high when GEX is positive. This means that high GEX values correspond to a calm market, while low GEX values indicate a volatile market. By monitoring the GEX, investors can gauge the overall sentiment of the market and make informed investment decisions.

Investors seeking a low-risk investment strategy can purchase when GEX is positive, indicating a stable market. Conversely, experienced investors who are knowledgeable about valuations, models, or technical analysis may opt to take a more aggressive approach and purchase when GEX is negative.

In conclusion, Sector GEX tables provide investors with a better way to gauge market volatility than traditional measures such as the VIX. By monitoring the GEX, investors can make informed investment decisions and potentially increase their profits.

Nifty GEX at What is GEX (Gamma Exposure)? .

Historically how Nifty GEX has moved at Historical Nifty GEX

Other links:

Other methodologies for calculation of GEX How to Calculate Gamma Exposure (GEX) and Zero Gamma Level 

 What is VIX? VIX


Historical HCL Technogies Gamma Exposure

 Below is the historical price chart of HCL Tech GEX for the period from December 21, 2021, to March 21, 2023. The chart indicates that as the stock price increases, the GEX of the stock remains positive, and the volatility decreases. On the other hand, when the stock price declines, the GEX remains in negative territory with increase in volatility.


Historical TCS Gamma Exposure

 Below is the historical price chart of TCS GEX for the period from December 21, 2021, to March 21, 2023. The chart indicates that as the stock price increases, the GEX of the stock remains positive, and the volatility decreases. On the other hand, when the stock price declines, the GEX remains in negative territory with increase in volatility.


Historical Infosys Gamma Exposure

Below is the historical price chart of Infosys GEX for the period from December 21, 2021, to March 21, 2023. The chart indicates that as the stock price increases, the GEX of the stock remains positive, and the volatility decreases. On the other hand, when the stock price declines, the GEX remains in negative territory with increase in volatility.


NiGEX (Nifty Gamma Exposure) 23rd March 2023

On March 23rd, 2023, the Nifty GEX (Gamma Exposure) showed negative trends, as it closed at -47L, a lower value than the day before yesterday's close (Update from 21st March). Additionally, the market structure has shown signs of deterioration. If the market continues to trade below 17100, it wouldn't be surprising to see it drop below to 16900 again. However, the upside potential lies at 17300, which coincidentally is also the 20-day moving average.

NiGEX has a history of significant fluctuations, as evident from its statistical measures over the last 200 days. The mean value during this period was -13K, with a median value of 743K. The value of NiGEX has fluctuated widely, with a minimum value of -116L and a maximum value of 50L.

Read more on Nifty GEX at What is GEX (Gamma Exposure)?


Is VIX really a measure of volatility for Nifty?

Volatility is a measure of how much a stock or an index moves up or down in price over a certain period of time. It's a critical aspect of the stock market, as investors need to know how much risk they're taking on when they invest in a particular stock or index.

In the Indian stock market, the VIX (Volatility Index) is often cited as the standard measure of volatility. The VIX is also referred to as the "fear index" because it's supposed to measure the level of fear or anxiety in the market. It's calculated based on the implied volatility of Nifty options, which are contracts that give the holder the right to buy or sell the Nifty index at a predetermined price within a specified time frame.

However, when we look at the Nifty market, it's clear that the VIX doesn't always behave in the way we would expect. For example, there have been instances when the market has fallen sharply, but the VIX hasn't risen as much as we might expect. This has led some investors to question whether the VIX is really an accurate measure of volatility in the Nifty market.


An alternative measure of gauge volatility could be Nifty GEX (Gamma Exposure). This index is calculated based on the gamma exposure of Nifty options, which is a measure of how much the price of an option will change for a given change in the price of the underlying asset. Essentially, the Nifty GEX measures how much the options market is exposed to changes in the Nifty index.

What's interesting is that the Nifty GEX can be seen from chart below to be a more reliable indicator of volatility in the Nifty market than the VIX. In fact, the Nifty GEX has always mirrored the volatility of the Nifty index perfectly, which is not always the case with the VIX.


 So, the question arises, should investors be looking at Nifty VIX or Nifty GEX for a more accurate measure of volatility in the Indian market? While the VIX is still a useful measure of volatility, the Nifty GEX is a more accurate measure of how much the market is likely to move in the near term. This is because the Nifty GEX is based on the actual positions taken by options traders, while the VIX is based on their expectations.

In conclusion, So, when it comes to assessing the level of volatility in the Nifty market, it may be more accurate to rely on the Nifty GEX rather than the VIX. However, it is important to keep in mind that both indicators are just that - indicators. They are not foolproof measures of volatility and should be used in conjunction with other fundamental and technical analysis tools to make informed investment decisions.

Read more on 

Nifty GEX at What is GEX (Gamma Exposure)? .

Historically how Nifty GEX has moved at Historical Nifty GEX


Historical Bajaj Finance Gamma Exposure

 This is the Bajaj Finance GEX and price chart for the period between December 15th, 2021 and March 22nd, 2023. 

For those who are unfamiliar, GEX stands for Gamma Exposure Index. It is a measure of the exposure of options traders to changes in the underlying contract, through their options positions. The GEX is calculated using a proprietary algorithm and is updated on a daily basis.

If you have any specific questions about the GEX or would like to know more information about how it is calculated, feel free to leave a comment and I will do my best to assist you.

Historical Vedanta Gamma Exposure

This is the Vedanta GEX and Vedanta price chart for the period between December 15th, 2021 and March 22nd, 2023. 


For those who are unfamiliar, GEX stands for Gamma Exposure Index. It is a measure of the exposure of options traders to changes in the underlying contract, through their options positions. The GEX is calculated using a proprietary algorithm and is updated on a daily basis.

If you have any specific questions about the GEX or would like to know more information about how it is calculated, feel free to leave a comment and I will do my best to assist you.

Historical Adani Enterprises Gamma Exposure

This is the Adani Enterprises GEX and Adani Enterprises price chart for the period between December 15th, 2021 and March 22nd, 2023. 


For those who are unfamiliar, GEX stands for Gamma Exposure Index. It is a measure of the exposure of options traders to changes in the underlying contract, through their options positions. The GEX is calculated using a proprietary algorithm and is updated on a daily basis.

If you have any specific questions about the GEX or would like to know more information about how it is calculated, feel free to leave a comment and I will do my best to assist you.

Weekly Expiry, NiGEX Mar'23, FOMC, Hindenburg

As of March 22nd, 2023, the Nifty GEX closed slightly above the previous day but remained below zero at -27L. The market structure has not changed and it is predicted that the Nifty may open around 17050, dip to the previously highlighted support of 17000, and the question remains whether it will surpass 17200 or drop below 17000. While the former is anticipated, the unpredictability of the market remains a factor.

Yesterday, as expected, the FOMC hiked interest rates by 25bps, signaling that the banking system is stable. JP reiterated this sentiment and emphasized the protection of deposits. However, JY's comment later caused early gains to be lost.

This morning, Hindenburg tweeted, expressing hope that there would not be another Indian corporate fiasco.


Read more on Nifty GEX at What is GEX (Gamma Exposure)?

Indian markets @10:27 am

The present trading value of Nifty stands at 17144, having touched a peak of 17207 and a trough of 17132. Although GEX remains in the negative territory, the market structure has shown signs of improvement.

As for F&O stocks, out of the total 191, 100 stocks are trading above their opening price while 91 have dipped. Moreover, 134 stocks are trading higher than their previous day's closing price, while 57 are trading below it.


Read more on Nifty GEX at What is GEX (Gamma Exposure)?

NiGEX (Nifty Gamma Exposure) 21st March 2023

On March 21st, 2023, NiGEX remained below zero, reaching a close of -36L, which was similar to the previous day's close. However, there has been an improvement in the market structure, with 17000 potentially acting as a support level. This improvement is primarily attributed to lower expected hikes.

NiGEX has experienced significant fluctuations in the past, as evidenced by its statistical measures. Looking at the last 200 days of data, the mean value was 29K and the median value was 797K. The value has fluctuated widely, with a minimum value of -116L and a maximum value of 50L.

Read more on Nifty GEX at What is GEX (Gamma Exposure)?

Nigex (Nifty Gamma Exposure) 20th March'23

    On March 20th, 2023, NiGEX's continued to stay below zero, hitting -60,30,463. The decline is likely due to the ongoing banking crisis in the developed world, which has caused a considerable amount of market volatility. Furthermore, it's possible that the increase in SP500 after the Indian market closed contributed to the drop from the previous day.

NiGEX has been subject to significant fluctuations, as evidenced by its statistical measures. Looking at the last 200 days of data, the mean value was 50,467 and the median value was 7,96,884. The value has fluctuated widely, with a minimum value of -11,64,8717 and a maximum value of 49,93,012.

Read more on Nifty GEX at What is GEX (Gamma Exposure)?

Nifty Closed 16988 above 16950 pivot (20/03/2023)

The closing value of Nifty was 16988, which is comfortably higher than the GEX pivot point of 16950. Mentioned in previous post Indian markets at mid day (12:30 pm) .

There has been a good recovery in F&O stocks from midday, as seen by the following numbers at 3:30PM:

 In the case of F&O stocks, 52 closed above opening level while 139 closed below opening proce . Additionally, 38 closed above previous day's close while 153 closed below.

For: Mid-day analysis read Mid-day analysis
 

Read more on 

Nifty GEX at What is GEX (Gamma Exposure)? .

Historically how Nifty GEX has moved at Historical Nifty GEX

Indian markets at mid day (12:30 pm)

Currently, Nifty is trading at 16866, with a high of 17067 and a low of 16850. GEX analysis pivots indicate that it is important to monitor the levels of 16950 and 17250.

In the case of F&O stocks, 37 have opened up from their initial price while 154 have opened down. Additionally, 24 have closed up from the previous day's close while 167 have closed down.

HDFC AMC has experienced a block trade worth 8071 cr, leading to trading volume that is 16 times the average by midday. The present price is 1694, with a high of 1722 and a low of 1590. According to GEX analysis pivots, it is important to pay attention to the levels of 1660 and 1720.


Read more on 

Nifty GEX at What is GEX (Gamma Exposure)? .

Historically how Nifty GEX has moved at Historical Nifty GEX


NiGEX (Nifty Gamma Exposure) 17 March 2023

On March 17th, 2023, NiGEX recorded a value of -37,40,826, which was below zero. This is likely due to the ongoing banking crisis in the developed world, which has caused significant volatility in the market. Few statistics of NiGEX are as below:

  • count: 313
  • mean: -32145.205
  • standard deviation: 3280635.245
  • minimum: -8159617
  • 25th percentile: -2762489
  • median: 238752
  • 75th percentile: 2283424
  • maximum: 5611111

Read more on Nifty GEX at What is GEX (Gamma Exposure)?

Historical Nifty Gamma Exposure (NiGEX) and Nifty

This is the Nifty GEX and Nifty chart for the period between December 15th, 2021 and March 21st, 2023. Moving forward, I will be providing daily updates on the Nifty GEX value. 


For those who are unfamiliar, Nifty GEX stands for Nifty Gamma Exposure Index. It is a measure of the exposure of options traders to changes in the underlying index, Nifty 50, through their options positions. The Nifty GEX is calculated using a proprietary algorithm and is updated on a daily basis.

If you have any specific questions about the Nifty GEX or would like to know more information about how it is calculated, feel free to leave a comment and I will do my best to assist you.


Read more on 

Nifty GEX at What is GEX (Gamma Exposure)? .

Historically how Nifty GEX has moved at Historical Nifty GEX


Nifty GEX (Gamma Exposure)

The Nifty GEX (Gamma Exposure) index measures the sensitivity of option contracts to changes in the underlying price, and can result in market price swings when imbalances occur. The absolute value of the GEX index represents the number of shares that will be bought or sold to push the price in the opposite direction of the trend when a 1% absolute move occurs. For example, if the GEX is at 5.0 million and the price moves +1%, then 5.0 million shares will be sold as a hedge to push the market to the downside. 

  • When GEX is a high number, it acts as a brake on market price.
  • When GEX is low (including negative), it acts as an accelerator.

 A high GEX acts as a brake on prices during a rising market, while a low (or negative) GEX acts as an accelerator.

Nifty Gamma Exposure 08th May 2023

     Nifty gamma exposure (NiGEX), which measures liquidity and volatility, rose on May 08th with a closing value of 44L, after being at -...