Updated Historical Kotak Mahindra Bank Gamma Exposure Chart

      Below is the historical chart of Kotak Mahindra Bank GEX for the period from January 19, 2022, to April 27, 2023. Gamma exposure, which measures liquidity and volatility, closed flat on April 27th with a closing value of 3L, after being at 3L on April 26th. 


 GEX was flat despite a rise in share price which closed with 1.5% on April 27th.  Again this could be attributed to monthly expiry. Additionally, GEX has exhibited volatile behavior over the past 200 days, with an average value of 2L and a median value of 2L. The value range has been wide, ranging from a low of -6L to a high of 10L.

Nifty GEX at What is GEX (Gamma Exposure)? .

Historically how Nifty GEX has moved at Historical Nifty GEX

Other links:

Other methodologies for calculation of GEX How to Calculate Gamma Exposure (GEX) and Zero Gamma Level

Nifty Gamma Exposure 27th April 2023

    Nifty gamma exposure (NiGEX), which measures liquidity and volatility, decreased on April 27th with a closing value of 23L, after being at 49L on April 26th. Not much to infer from this drop. As this fall can be attributed to monthly expiry yesterday.  While this indicates a positive gamma environment, it's important to note that NiGEX should not be the sole factor in making investment decisions. Theta, the cost of owning gamma, benefits option owners in this scenario, as well as rewards delta, with call owners seeing a positive effect when asset prices rise. This also reduces directional risk and variance.

A decrease in NiGEX, was primarily due to monthly expiry yesterday. However Nifty closed with 0.6% gains on April 27th. Additionally, NiGEX has exhibited volatile behavior over the past 200 days, with an average value of 278K and a median value of 1097K. The value range has been wide, ranging from a low of -116L to a high of 50L.

 To learn more about Gamma Exposure and NiGex, refer to the article on What is GEX (Gamma Exposure)?  

To know more about VIX, visit the NSE page at VIX

Updated Historical Tech Mahindra Gamma Exposure Chart

     Below is the historical chart of Tech Mahindra GEX for the period from January 18, 2022, to April 26, 2023. Gamma exposure, which measures liquidity and volatility, closed with a fall on April 26th with a closing value of -3L, after being at -2L on April 25th. 


 A decrease in GEX correlates with a fall in share price which closed with -0.1% drop on April 26th. Additionally, GEX has exhibited volatile behavior over the past 200 days, with an average value of 1L and a median value of 1L. The value range has been wide, ranging from a low of -5L to a high of 11L.

Nifty GEX at What is GEX (Gamma Exposure)? .

Historically how Nifty GEX has moved at Historical Nifty GEX

Other links:

Other methodologies for calculation of GEX How to Calculate Gamma Exposure (GEX) and Zero Gamma Level

Updated Historical Hindustan Unilever Gamma Exposure Chart

     Below is the historical chart of Hindustan Unilever GEX for the period from January 18, 2022, to April 26, 2023. Gamma exposure, which measures liquidity and volatility, closed sharply higher with a rise on April 26th with a closing value of 44K, after being at -35L on April 25th. 


A sharp increase in GEX compared to with a rise in share price which closed with 1.0% gains on April 26th. Additionally, GEX has exhibited volatile behavior over the past 200 days, with an average value of 87K and a median value of 64K. The value range has been wide, ranging from a low of -2L to a high of 4L.

Nifty GEX at What is GEX (Gamma Exposure)? .

Historically how Nifty GEX has moved at Historical Nifty GEX

Other links:

Other methodologies for calculation of GEX How to Calculate Gamma Exposure (GEX) and Zero Gamma Level

Updated Historical Wipro Gamma Exposure Chart

    Below is the historical chart of Wipro GEX for the period from January 18, 2022, to April 26, 2023. Gamma exposure, which measures liquidity and volatility, closed with a drop on April 26th with a closing value of 3L, after being at 5L on April 25th. 

 A sharp decrease in GEX compared with muted fall in share price which closed with 0.1% fall on April 26th. Additionally, GEX has exhibited volatile behavior over the past 200 days, with an average value of 3L and a median value of 3L. The value range has been wide, ranging from a low of -17L to a high of 21L.

Nifty GEX at What is GEX (Gamma Exposure)? .

Historically how Nifty GEX has moved at Historical Nifty GEX

Other links:

Other methodologies for calculation of GEX How to Calculate Gamma Exposure (GEX) and Zero Gamma Level

Updated Historical Axis Bank Gamma Exposure Chart

     Below is the historical chart of Axis Bank GEX for the period from January 18, 2022, to April 26, 2023. Gamma exposure, which measures liquidity and volatility, closed with a rise on April 26th with a closing value of 12LK, after being at 9L on April 25th. 


 An increase in GEX correlates with a rise in share price which closed with 0.9% gains on April 26th. Additionally, GEX has exhibited volatile behavior over the past 200 days, with an average value of 9L and a median value of 8L. The value range has been wide, ranging from a low of -13L to a high of 35L.

Nifty GEX at What is GEX (Gamma Exposure)? .

Historically how Nifty GEX has moved at Historical Nifty GEX

Other links:

Other methodologies for calculation of GEX How to Calculate Gamma Exposure (GEX) and Zero Gamma Level

Nifty Gamma Exposure 26th April 2023

    Nifty gamma exposure (NiGEX), which measures liquidity and volatility, increased on April 26th with a closing value of 49L, after being at 38L on April 25th. While this indicates a positive gamma environment, it's important to note that NiGEX should not be the sole factor in making investment decisions. Theta, the cost of owning gamma, benefits option owners in this scenario, as well as rewards delta, with call owners seeing a positive effect when asset prices rise. This also reduces directional risk and variance.

An increase in NiGEX, was more pronounced than smaller increase in Nifty which closed with 0.3% gains on April 26th. Additionally, NiGEX has exhibited volatile behavior over the past 200 days, with an average value of 271K and a median value of 1073K. The value range has been wide, ranging from a low of -116L to a high of 50L.

 To learn more about Gamma Exposure and NiGex, refer to the article on What is GEX (Gamma Exposure)?  

To know more about VIX, visit the NSE page at VIX

Updated Historical Bajaj Finance Gamma Exposure Chart

     Below is the historical chart of Bajaj Finance GEX for the period from January 17, 2022, to April 25, 2023. Gamma exposure, which measures liquidity and volatility, closed with a rise on April 25th with a closing value of 215K, after being at 109K on April 24th. 


 A sharp increase in GEX correlates with rise in share price which closed with 2.4% gains on April 25th. Additionally, GEX has exhibited volatile behavior over the past 200 days, with an average value of 26K and a median value of 27K. The value range has been wide, ranging from a low of -385K to a high of 279K.

Nifty GEX at What is GEX (Gamma Exposure)? .

Historically how Nifty GEX has moved at Historical Nifty GEX

Other links:

Other methodologies for calculation of GEX How to Calculate Gamma Exposure (GEX) and Zero Gamma Level 

Updated Historical Maruti Gamma Exposure Chart

    Below is the historical chart of Maruti GEX for the period from January 17, 2022, to April 25, 2023. Gamma exposure, which measures liquidity and volatility, closed neutral on April 25th with a closing value of 2K, after being at -18K on April 24th.


A slight increase in GEX with flat share price which closed with 0.3% gains on April 25th. Additionally, GEX has exhibited volatile behavior over the past 200 days, with an average value of 47K and a median value of 53K. The value range has been wide, ranging from a low of -234K to a high of 261K.

Nifty GEX at What is GEX (Gamma Exposure)? .

Historically how Nifty GEX has moved at Historical Nifty GEX

Other links:

Other methodologies for calculation of GEX How to Calculate Gamma Exposure (GEX) and Zero Gamma Level 

Nifty Gamma Exposure 25th April 2023

    Nifty gamma exposure (NiGEX), which measures liquidity and volatility, decreased slightly on April 25th with a closing value of 38L, after being at 43L on April 24th. While this indicates a positive gamma environment, it's important to note that NiGEX should not be the sole factor in making investment decisions. Theta, the cost of owning gamma, benefits option owners in this scenario, as well as rewards delta, with call owners seeing a positive effect when asset prices rise. This also reduces directional risk and variance.

A small drop in NiGEX, is inline with flat Nifty which closed with 0.2% gains on April 25th. Additionally, NiGEX has exhibited volatile behavior over the past 200 days, with an average value of 244K and a median value of 1061K. The value range has been wide, ranging from a low of -116L to a high of 50L.

 To learn more about Gamma Exposure and NiGex, refer to the article on What is GEX (Gamma Exposure)?  

To know more about VIX, visit the NSE page at VIX

Nifty Gamma Exposure 24th April 2023

    Nifty gamma exposure (NiGEX), which measures liquidity and volatility, saw a sharp increase on April 24th with a closing value of 43L, after being at 13L on April 21st. While this indicates a positive gamma environment, it's important to note that NiGEX should not be the sole factor in making investment decisions. Theta, the cost of owning gamma, benefits option owners in this scenario, as well as rewards delta, with call owners seeing a positive effect when asset prices rise. This also reduces directional risk and variance.

It's worth mentioning that despite sharp increase in NiGEX, the Nifty closed with 0.7% gains on April 24th. Additionally, NiGEX has exhibited volatile behavior over the past 200 days, with an average value of 217K and a median value of 1051K. The value range has been wide, ranging from a low of -116L to a high of 50L.

 To learn more about Gamma Exposure and NiGex, refer to the article on What is GEX (Gamma Exposure)?  

To know more about VIX, visit the NSE page at VIX

Nifty Gamma Exposure 21st April 2023

Nifty gamma exposure (NiGEX), which measures liquidity and volatility, saw a positive turn on April 21st with a closing value of 13L, after being at -3L on April 20th. While this indicates a positive gamma environment, it's important to note that NiGEX should not be the sole factor in making investment decisions. Theta, the cost of owning gamma, benefits option owners in this scenario, as well as rewards delta, with call owners seeing a positive effect when asset prices rise. This also reduces directional risk and variance.

It's worth mentioning that despite the positive turn in NiGEX, the Nifty closed flat at 0.00% on April 21st. Additionally, NiGEX has exhibited volatile behavior over the past 200 days, with an average value of 187K and a median value of 1030K. The value range has been wide, ranging from a low of -116L to a high of 50L.

 To learn more about Gamma Exposure and NiGex, refer to the article on What is GEX (Gamma Exposure)?  

To know more about VIX, visit the NSE page at VIX

Updated Historical ICICI Bank Gamma Exposure Chart

    Below is the historical chart of ICIC Bank GEX for the period from January 13, 2022, to April 21, 2023.


The chart indicates that as the stock price increases, the GEX of the stock remains positive, and the volatility decreases. On the other hand, when the stock price declines, the GEX remains in negative territory with increase in volatility. 

 Nifty GEX at What is GEX (Gamma Exposure)? .

Historically how Nifty GEX has moved at Historical Nifty GEX

Other links:

Other methodologies for calculation of GEX How to Calculate Gamma Exposure (GEX) and Zero Gamma Level 

Updated Historical Reliance Industries Gamma Exposure Chart

    Below is the historical chart of Reliance Industries GEX for the period from January 12, 2022, to April 20, 2023.


The chart indicates that as the stock price increases, the GEX of the stock remains positive, and the volatility decreases. On the other hand, when the stock price declines, the GEX remains in negative territory with increase in volatility. 


Nifty GEX at What is GEX (Gamma Exposure)? .

Historically how Nifty GEX has moved at Historical Nifty GEX

Other links:

Other methodologies for calculation of GEX How to Calculate Gamma Exposure (GEX) and Zero Gamma Level 
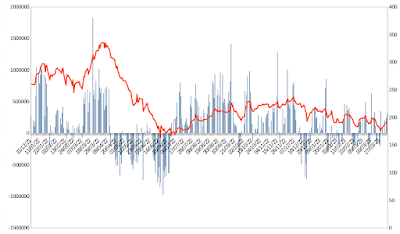
Nifty Gamma Exposure 20th April 2023

 On April 20th, Nifty Gamma exposure (NiGEX) closed at -3L, a receovery from its value of -16L on April 19th. It's crucial to remember that NiGEX serves only as a measure of liquidity and volatility, and investors should not rely solely on it to make investment decisions.

However, Nifty just closed flat 0.03% on April 20th. We have highlighted NiGEX's volatile behavior over the past 200 days, with an average value of 181K and a median value of 1012K. The value range has been extensive, ranging from a low of -116L to a high of 50L.

To learn more about Gamma Exposure and NiGex, refer to the article on What is GEX (Gamma Exposure)?  

To know more about VIX, visit the NSE page at VIX

Nifty Gamma Exposure 19th April 2023

 On April 19th, Nifty Gamma exposure (NiGEX) closed at -16L, a sharp drop from its value of 12L on April 18th. Also, it turned negative. It's crucial to remember that NiGEX serves only as a measure of liquidity and volatility, and investors should not rely solely on it to make investment decisions.

However, Nifty just fell by -0.2% on April 19th. We have highlighted NiGEX's volatile behavior over the past 200 days, with an average value of 181K and a median value of 1012K. The value range has been extensive, ranging from a low of -116L to a high of 50L.

To learn more about Gamma Exposure and NiGex, refer to the article on What is GEX (Gamma Exposure)?  

To know more about VIX, visit the NSE page at VIX

Nifty Gamma Exposure 18th April 2023

 On April 18th, Nifty Gamma exposure (NiGEX) closed at 12L, a decent drop from its value of 23L on April 17th. It's crucial to remember that NiGEX serves only as a measure of liquidity and volatility, and investors should not rely solely on it to make investment decisions.

However, Nifty just fell by -0.3% on April 18th. VIX dropped slightly slightly to 12.08. In our previous post, we highlighted NiGEX's volatile behavior over the past 200 days, with an average value of 187K and a median value of 1012K. The value range has been extensive, ranging from a low of -116L to a high of 50L.

To learn more about Gamma Exposure and NiGex, refer to the article on What is GEX (Gamma Exposure)?  

To know more about VIX, visit the NSE page at VIX

Nifty Gamma Exposure 17th April 2023

 On April 17th, Nifty Gamma exposure (NiGEX) closed at 23L, a slight drop from its value of 27L on April 17th. It's crucial to remember that NiGEX serves only as a measure of liquidity and volatility, and investors should not rely solely on it to make investment decisions.

However, Nifty fell by -0.7% on April 17th. VIX rose slightly slightly to 12.26. In our previous post, we highlighted NiGEX's volatile behavior over the past 200 days, with an average value of 168K and a median value of 1008K. The value range has been extensive, ranging from a low of -116L to a high of 50L.

To learn more about Gamma Exposure and NiGex, refer to the article on What is GEX (Gamma Exposure)?  

To know more about VIX, visit the NSE page at VIX

Nifty Gamma Exposure 13th April 2023

 On April 13th, Nifty Gamma exposure (NiGEX) closed at 27L, a slight drop from its value of 28L on April 12th. However, it's crucial to remember that NiGEX serves only as a measure of liquidity and volatility, and investors should not rely solely on it to make investment decisions.

Additionally, Nifty also closed flat, rising by mere 0.1% on April 13th. In-line, VIX also closed flat falling slightly to 11.91. In our previous post, we highlighted NiGEX's volatile behavior over the past 200 days, with an average value of 130K and a median value of 1000K. The value range has been extensive, ranging from a low of -116L to a high of 50L.

To learn more about Gamma Exposure and NiGex, refer to the article on What is GEX (Gamma Exposure)?  

To know more about VIX, visit the NSE page at VIX

Updated Historical HDFC Bank Gamma Exposure Chart

  HDFC Bank Gamma Exposure (GEX) rose marginally from from 13L PD to 14L due to a 1.0% rise in HDFC Banks's share price. It's important to exercise caution as HDFC Banks's quarterly results are due over weekend.

Looking at the historical chart of HDFC Bank GEX from January 05, 2022, to April 12, 2023, it's evident that as the stock price rises, the GEX remains positive, and the volatility decreases. Conversely, when the stock price drops, the GEX stays in negative territory with an increase in volatility.

Nifty GEX at What is GEX (Gamma Exposure)? .

Historically how Nifty GEX has moved at Historical Nifty GEX

Other links:

Other methodologies for calculation of GEX How to Calculate Gamma Exposure (GEX) and Zero Gamma Level 


Nifty Gamma Exposure 12th April 2023

 On April 12th, Nifty Gamma exposure (NiGEX) closed at 28L, a drop from its value of 36L on April 11th. However, it's crucial to remember that NiGEX serves only as a measure of liquidity and volatility, and investors should not rely solely on it to make investment decisions.

However Nifty showed a positive trend, rising by 0.5% on April 12th. In our previous post, we highlighted NiGEX's volatile behavior over the past 200 days, with an average value of 109K and a median value of 944K. The value range has been extensive, ranging from a low of -116L to a high of 50L.

To learn more about Gamma Exposure and NiGex, refer to the article on What is GEX (Gamma Exposure)?  

To know more about VIX, visit the NSE page at VIX

Updated Historical Infy Gamma Exposure Chart

 Infosys Gamma Exposure (GEX) saw a drop from 295K PD to 24K due to a -1.4% decline in Infy's share price. It's important to exercise caution as Infy's quarterly results are due tomorrow. Moreover, Accenture's layoffs last month due to a lowered IT spending, outlook from TCS and Infosys will be closely monitored.


 Looking at the historical chart of Infy GEX from January 04, 2022, to April 11, 2023, it's evident that as the stock price rises, the GEX remains positive, and the volatility decreases. Conversely, when the stock price drops, the GEX stays in negative territory with an increase in volatility.

Nifty GEX at What is GEX (Gamma Exposure)? .

Historically how Nifty GEX has moved at Historical Nifty GEX

Other links:

Other methodologies for calculation of GEX How to Calculate Gamma Exposure (GEX) and Zero Gamma Level 


Nifty Gamma Exposure 11th April 2023

    On April 11th, Nifty Gamma exposure (NiGEX) closed at 36L, a significant increase from its value of 19L on April 10th. However, it's crucial to remember that NiGEX serves only as a measure of liquidity and volatility, and investors should not rely solely on it to make investment decisions.

The Nifty also showed a positive trend, rising by 0.6% on April 11th. Nevertheless, investors should be cautious as the CPI for both the United States and India will be released after the market closes. In our previous post, we highlighted NiGEX's erratic behavior over the past 200 days, with an average value of 69K and a median value of 883K. The value range has been extensive, ranging from a low of -116L to a high of 50L.

To learn more about Gamma Exposure and NiGex, refer to the article on What is GEX (Gamma Exposure)?  

To know more about VIX, visit the NSE page at VIX

Updated Historical TCS Gamma Exposure Chart

TCS (Tata Consultancy Services) Gamma Exposure (GEX) saw a drop from 138K PD to 58K due to a -1.6% decline in TCS's share price. It's important to exercise caution as TCS's quarterly results are expected to be released today. Moreover, Accenture's layoffs last month due to a lowered IT spending outlook from TCS will be closely monitored.

 Looking at the historical chart of TCS GEX from January 03, 2022, to April 10, 2023, it's evident that as the stock price rises, the GEX remains positive, and the volatility decreases. Conversely, when the stock price drops, the GEX stays in negative territory with an increase in volatility.

Nifty GEX at What is GEX (Gamma Exposure)? .

Historically how Nifty GEX has moved at Historical Nifty GEX

Other links:

Other methodologies for calculation of GEX How to Calculate Gamma Exposure (GEX) and Zero Gamma Level 


Nifty Gamma Exposure 10th April 2023

    On April 10th, the Nifty GEX Gamma Exposure, also known as NiGex, closed with a bang at 19L, soaring high above its April 6th value of 12L. However, let's not forget that NiGex is merely a gauge of liquidity and volatility, and investors shouldn't rely solely on it to make investment decisions.

Although NiGex's surge was impressive, the Nifty only experienced a meager 0.1% growth on April 6th, indicating a favorable but not overly enthusiastic market trend. In our previous post, we highlighted NiGex's wild fluctuations over the past 200 days, with an average value of 20K and a median value of 844K. The value range has been expansive, spanning from a low of -116L to a high of 50L. These ups and downs underscore the need for comprehensive research and caution before investing in NiGex.

To learn more about Gamma Exposure and NiGex, refer to the article on What is GEX (Gamma Exposure)? To know more about VIX, visit the NSE page at VIX

Historical Delta Corp Gamma Exposure Chart

 Below is the historical chart of Dela Corp GEX for the period from December 27, 2021, to March 29, 2023. The chart indicates that as the stock price increases, the GEX of the stock remains positive, and the volatility decreases. On the other hand, when the stock price declines, the GEX remains in negative territory with increase in volatility.


Nifty GEX at What is GEX (Gamma Exposure)? .

Historically how Nifty GEX has moved at Historical Nifty GEX

Other links:

Other methodologies for calculation of GEX How to Calculate Gamma Exposure (GEX) and Zero Gamma Level 

Historical Tata Motors Gamma Exposure Chart

 Below is the historical chart of Tata Motors GEX for the period from December 27, 2021, to March 29, 2023. The chart indicates that as the stock price increases, the GEX of the stock remains positive, and the volatility decreases. On the other hand, when the stock price declines, the GEX remains in negative territory with increase in volatility.


Nifty GEX at What is GEX (Gamma Exposure)? .

Historically how Nifty GEX has moved at Historical Nifty GEX

Other links:

Other methodologies for calculation of GEX How to Calculate Gamma Exposure (GEX) and Zero Gamma Level 


Nifty Gamma Exposure 06th April 2023

    The Nifty GEX Gamma Exposure closed positively at 12L on April 6th, which is a contrast to its value of -6L on April 5th. However, it's crucial to note that NiGex should only serve as an indicator of liquidity or volatility, and investors must not solely base their investment decisions on it.

Although NiGex became positive, the Nifty only had a flat growth of 0.2% on April 5th, indicating a favorable market trend. In our previous post, we discussed how NiGex has experienced significant fluctuations over the past 200 days, with a mean value of -25K and a median value of 797K. The range of values has been extensive, with a minimum of -116L and a maximum of 50L. These variations highlight the importance of conducting comprehensive research and exercising caution before investing in NiGex.

To learn more about Gamma Exposure and NiGex, refer to the article on What is GEX (Gamma Exposure)? To know more about VIX, visit the NSE page at VIX

Nifty Gamma Exposure 05th April 2023

    On April 5th, the Nifty GEX Gamma Exposure saw a decrease in value, closing at -6L. This value is in contrast to the value observed on April 3rd, where NiGex closed at -2L. It is important to note that NiGex should only be used as a gauge of volatility or liquidity, and its value alone should not be the sole factor in any investment decision.

Despite the decrease in NiGex value, the Nifty rose by 0.8% on April 5th, indicating a positive market trend. However, it is pretty straight forward to explain it but would keep reason for this anomaly: It is crucial to consider various factors, including market trends, economic indicators, and financial news, before making any investment decisions.

As we mentioned in our earlier post, NiGex has seen significant variations in its value over the past 200 days, with a mean value of -58K and a median value of 743K. The range of values has been substantial, with a minimum of -116L and a maximum of 50L. These variations highlight the importance of conducting thorough research and exercising caution before investing in NiGex.

For further information on Gamma Exposure and NiGex, visit the article at What is GEX (Gamma Exposure)? To know more about VIX, visit the NSE page at VIX


Updated Historical Bajaj Finance Gamma Exposure Chart

Below is the historical chart of Reliance Industries GEX for the period from December 27, 2021, to March 29, 2023. The chart indicates that as the stock price increases, the GEX of the stock remains positive, and the volatility decreases. On the other hand, when the stock price declines, the GEX remains in negative territory with increase in volatility.


Nifty GEX at What is GEX (Gamma Exposure)? .

Historically how Nifty GEX has moved at Historical Nifty GEX

Other links:

Other methodologies for calculation of GEX How to Calculate Gamma Exposure (GEX) and Zero Gamma Level 


Historical HDFC Bank Gamma Exposure Chart

Below is the historical chart of Reliance Industries GEX for the period from December 27, 2021, to March 29, 2023. The chart indicates that as the stock price increases, the GEX of the stock remains positive, and the volatility decreases. On the other hand, when the stock price declines, the GEX remains in negative territory with increase in volatility.


Nifty GEX at What is GEX (Gamma Exposure)? .

Historically how Nifty GEX has moved at Historical Nifty GEX

Other links:

Other methodologies for calculation of GEX How to Calculate Gamma Exposure (GEX) and Zero Gamma Level 


Nifty Gamma Exposure 03rd April 2023

NiGex, also known as the Nifty GEX Gamma Exposure, saw an increase in value on April 3rd, 2023, closing at -2L, which was higher than the previous day's value. It's important to note that GEX should only be used as a gauge of volatility or liquidity. If GEX > 0, it's recommended to buy low and sell high, while a GEX < 0 may indicate a market trend according to price action.

In our previous update, we mentioned that a Nifty rise of 1.6% on Friday could provide an opportunity to improve its structure, provided it remained above 17200. It has done so, but the value is still slightly negative. When looking at the past 200 days of NiGex, there have been significant variations in its value. The mean value over this period was -82K, while the median value was 743K. The range of values has been substantial, with a minimum of -116L and a maximum of 50L. This data emphasizes the need for thorough research and caution before making any investment decisions related to NiGex.

For further information on Gamma Exposure and NiGex, visit the article at What is GEX (Gamma Exposure)? To know more about VIX, visit the NSE page at VIX


Nifty Gamma Exposure 31st March 2023

On March 31st, 2023, NiGex (the Nifty GEX Gamma Exposure) value increased and closed at -11L, which was higher than the previous day's value. However, analyzing these derived numbers may not be useful, as GEX should only be used as a gauge of volatility or liquidity. If GEX > 0, it's recommended to buy low and sell high, while a GEX < 0 may indicate a market trend according to price action.

Last Friday, Nifty rose by approximately 1.6%, and if it remains above 17200, it may provide an opportunity to improve its structure. Looking back at the past 200 days of NiGex, it's clear that there have been significant variations in its value. The mean value over this period was -110K, while the median value was 743K. The range of values has been substantial, with a minimum of -116L and a maximum of 50L. This data underscores the importance of conducting thorough research and exercising caution before making any investment decisions related to NiGex.

For further information on Gamma Exposure and NiGex, visit the article at What is GEX (Gamma Exposure)? To know more about VIX, visit the NSE page at VIX

Sector GEX Table Updated Mar 31st 2023

Investing in the stock market can be a daunting task, especially for those who are new to it. With so many companies and industries to choose from, it can be difficult to know where to start. Fortunately, there are tools and resources available to help investors make informed decisions.

One such tool is the Sector GEX Table, which provides valuable insights into the performance of different sectors of the stock market. The table displays the performance of various sectors of the stock market over different time periods.

The Sector GEX Table is particularly useful for investors who are interested in thematic investing. Thematic investing involves investing in companies that are part of a particular theme or trend. By using the Sector GEX Table, investors can easily identify which sectors are performing well within a particular theme and adjust their investments accordingly.

Overall, the Sector GEX Table is an invaluable tool for investors who are interested in thematic investing or want to gain a better understanding of the performance of different sectors of the stock market. By using this tool, investors can make more informed investment decisions and potentially increase their returns while minimizing their risks.

Nifty GEX at What is GEX (Gamma Exposure)? .

Historically how Nifty GEX has moved at Historical Nifty GEX

Other links:

Other methodologies for calculation of GEX How to Calculate Gamma Exposure (GEX) and Zero Gamma Level 

 What is VIX? VIX


Nifty Gamma Exposure 08th May 2023

     Nifty gamma exposure (NiGEX), which measures liquidity and volatility, rose on May 08th with a closing value of 44L, after being at -...